GDP per capita and life expectancy scatterplot
A Plotly scatterplot example that lets students inspect the relationship between economic and health measures using code-generated visual output.
Open full exampleQBUS6860 Visual Data Analytics
This public gallery collects shareable QBUS6860 teaching artifacts: interactive Plotly examples, animated visual explanations, a podcast, two summary songs, a wordcloud, and multimodal recap materials. Students can inspect, replay, and revisit the materials directly, using interaction, animation, audio, and creative summary as different routes into visual analytics ideas.
Private Ed screenshots, student-response evidence, and formal survey reports are intentionally excluded from this public site.
Interactive examples
A Plotly scatterplot example that lets students inspect the relationship between economic and health measures using code-generated visual output.
Open full exampleA map-based Plotly example for discussing spatial visualisation, geographic comparison, and the interpretive choices behind choropleths.
Open full exampleA compact interactive example for explaining how categorical flow, source-target structure, and magnitude can be communicated visually.
Open full exampleAnimated explanations
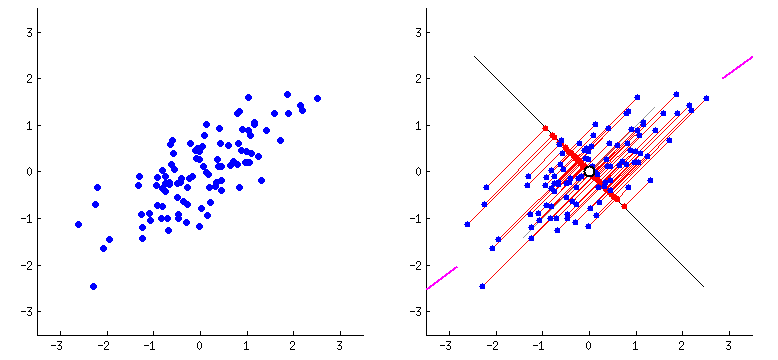
Shows how point patterns and fitted lines can be discussed as visual reasoning, not just formulas.
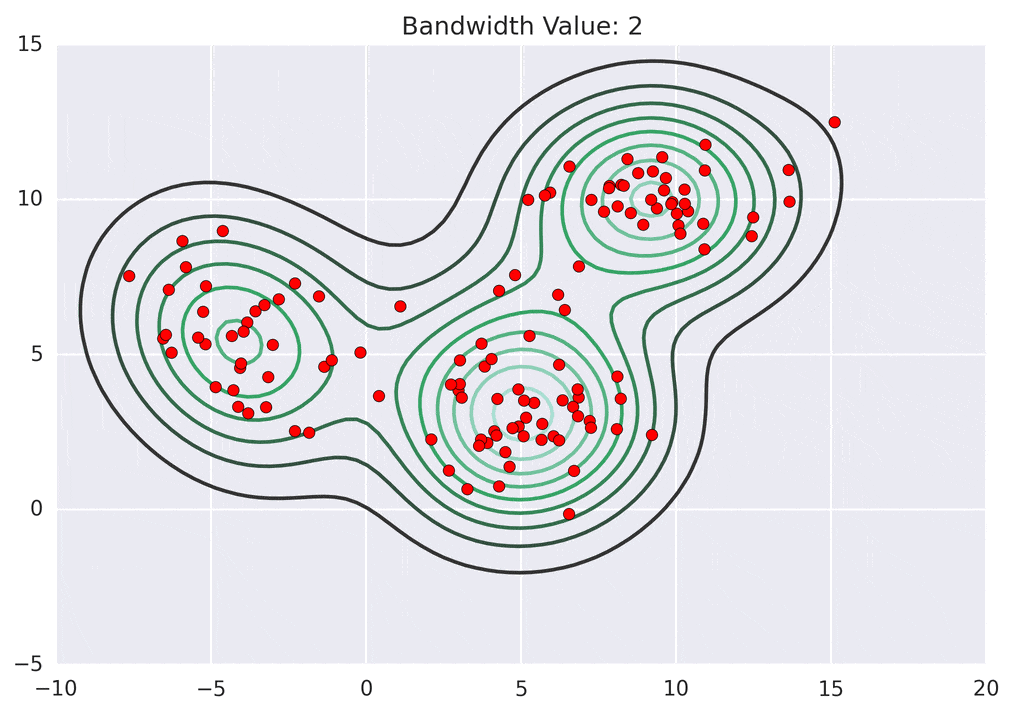
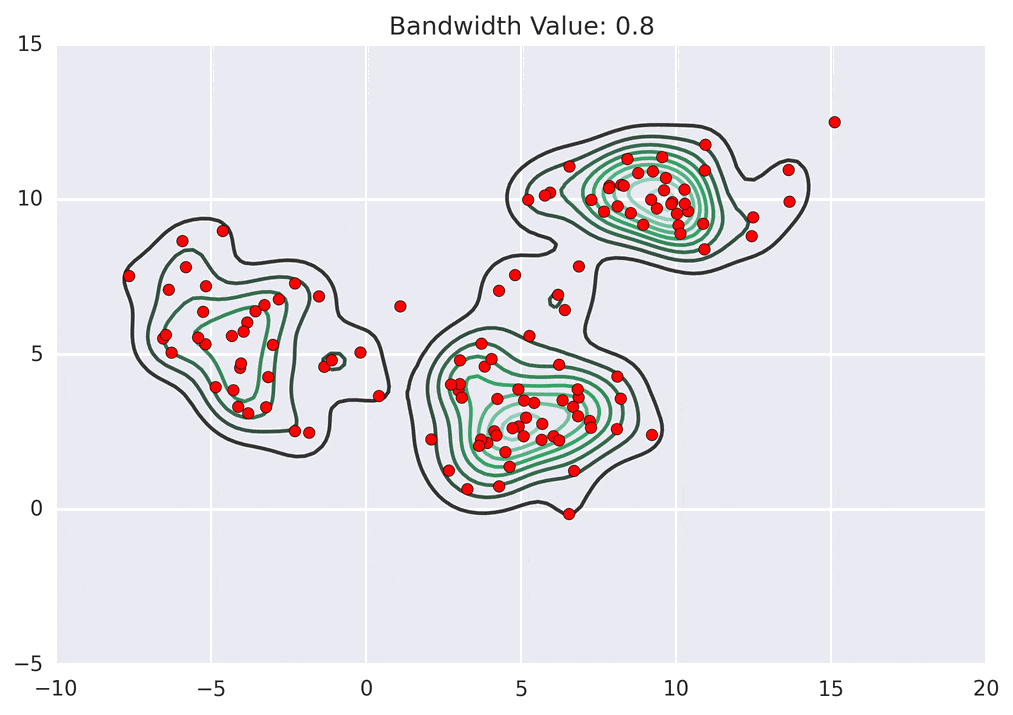
Illustrates how smoothing decisions shape the story told by a contour visualisation.
Contrasts with the broader example so students can compare sensitivity to parameter choice.
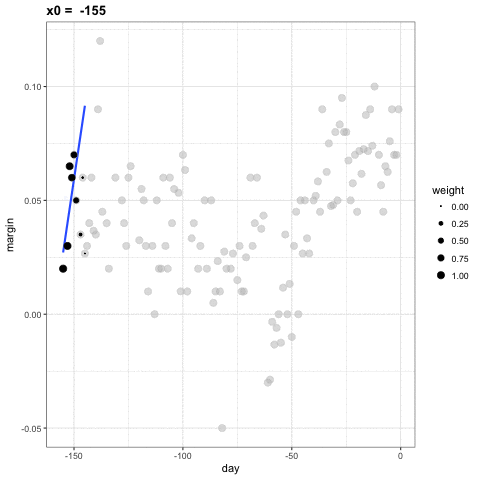
Uses animation to make changing local structure and weighting easier to see.
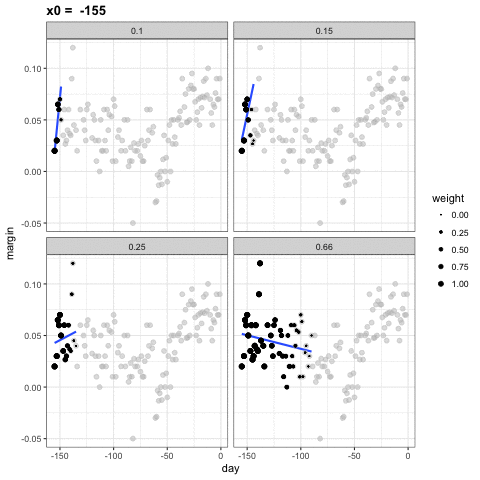
Supports discussion of how the same data can be viewed through multiple local windows.
Audio and recap materials
A longer-form audio recap for revisiting introductory visual analytics concepts outside class.
Open audio file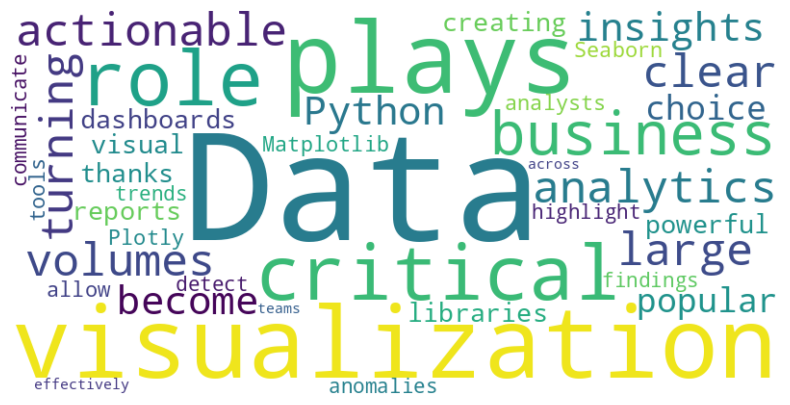
A quick visual summary of recurring unit themes such as data, visualisation, business, and critical thinking.